A typical stress and strain curve of concrete in compression. The curve is usually obtained by testing a cylinder with a height-to-lateral dimension ratio of at least 2, the test is conducted under a uniform rate of strain. If a uniform rate of stress is adopted, it will not be possible to obtain the descending portion of stress and strain curve beyond the maximum stress.
Stress Starin Curve Equation
An equation representing the stress and strain curve completely should satisfy the following conditions.
(i) at f= 0, €= 0 and (df)/(d*€) = E_{t}
(ii) at f = f_{0}, € = €_{0} and (df)/(d*€) = 0
(iii) at f = f_{f} €= €_{u}
Treating the concrete as a linearly elastic material. This approximation is used in the working stress method of design of structural concrete without much loss of accuracy up to about 50 percent f_{0}. For all practical purposes, the concrete could be considered a linear elastic material when stress does not exceed 0.5f_{0}
The maximum strain in concrete, εcu, at the outermost compression fibre is assumed to be 0.0035 in bending. ( It should be noted that the value of εcu will reduce as the concrete strength increases, especially for HSC. CEB-FIP model code 1990 suggests εcu = 0.0035 for fck ≤ 50 Mpa and εcu = 0.0035 50/fck for 50 Mpa < fck ≤ 80 Mpa.

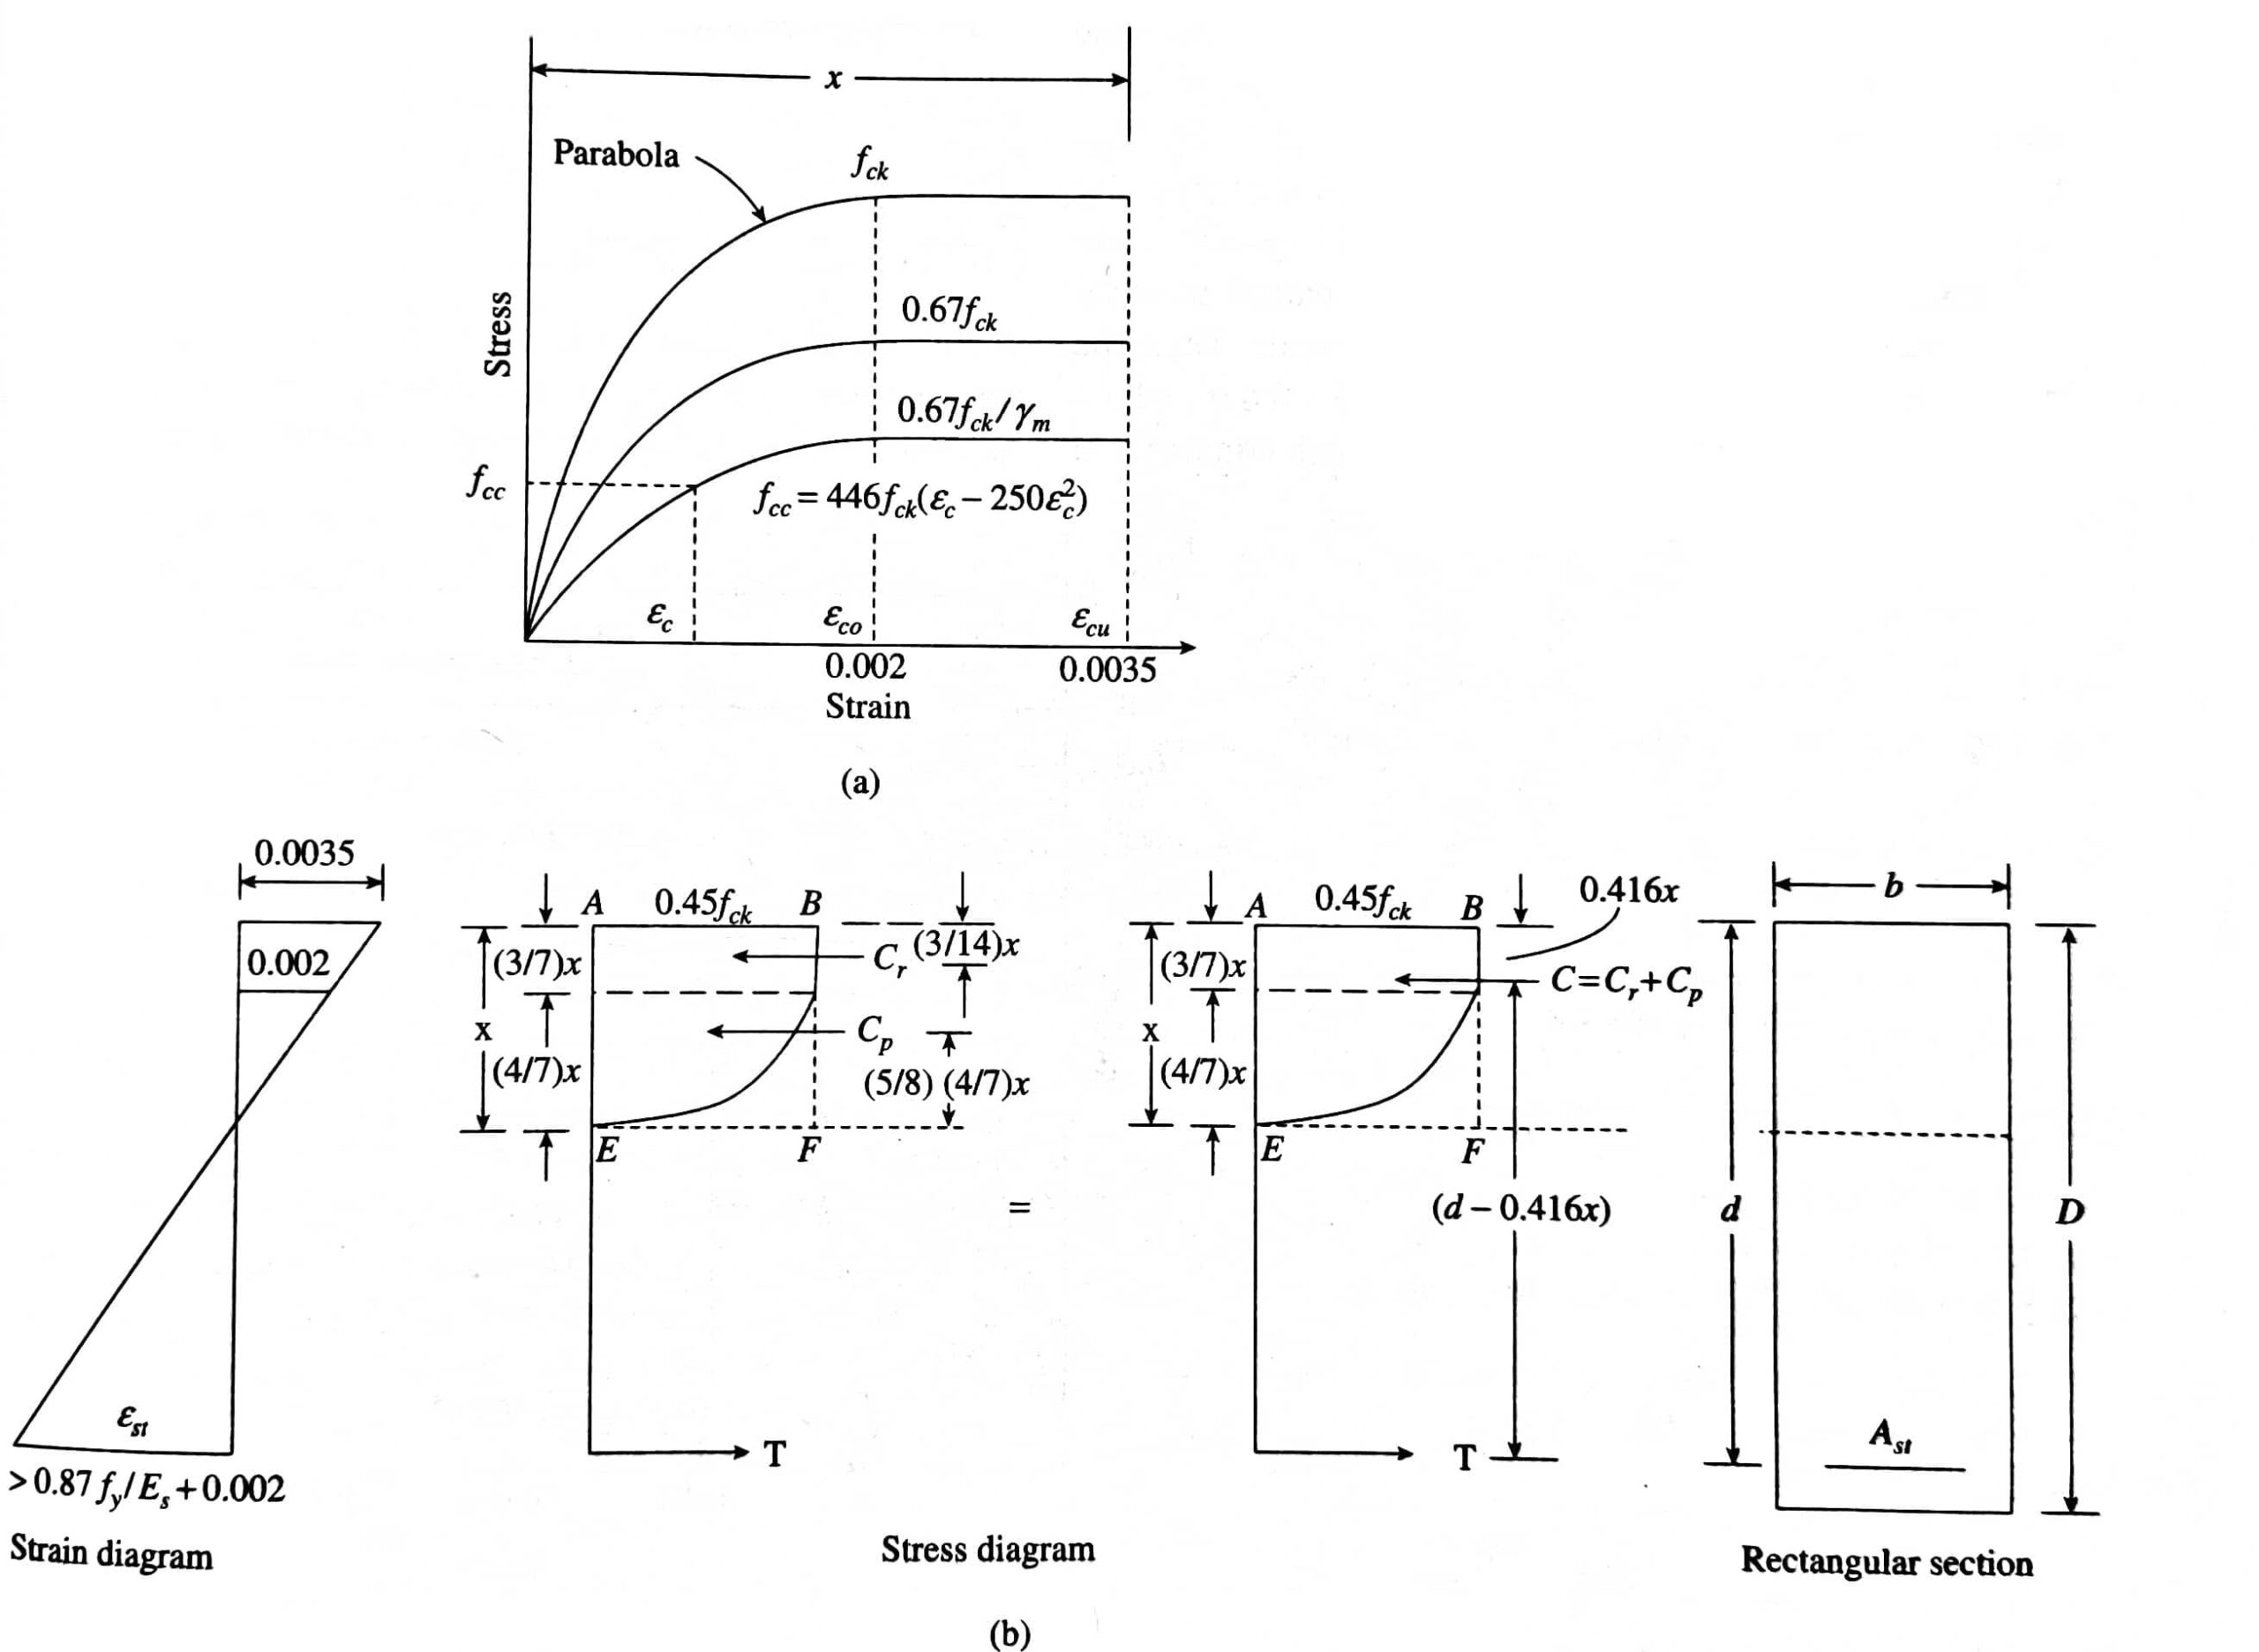
Compressive stress distribution is assumed to correspond with the assumed stress-strain diagram of concrete, as shown in figure. The stress block in IS 456 is assumed as parabolic-rectangular, as shown in fig. It has to be notes that the geometrical shape of the stress distribution depends upon the number of factor ,the rate , the duration of loading and also cube/cylinder strength.
Several studies have indicated that the ratio od maximum compressive strength in beams or columns to the cylinder compressive strength, f’c can be taken as being equal to 0.85 for most practical purposes. This accounts for the size effect and the fact that the actual beam is subjected to sustained loading, whereas the test cylinder subjected to short-term loading alone.
Furthermore, the cylinder strength, f’c is assumed to be 0.85 x 0.8 = 0.67 times the characteristic cube compressive strength. With an additional partial material safety factor γm of 1.5, the maximum compressive strength will be equal to 0.67/1.5 = 0.447 fck, which is normally rounded off to 0.45 fck, It should be noted that the partial safety factor is applied over the whole stress-strain curve, as shown in figure, is parabolic from the starting point of zero strain up to a strain of 0.002, and then a straight line from this point up to the crushing strain of 0.0035. The same shape is adopted for the stress block too in the Indian code.
If the distance upto 0.0035 strain is denoted as X, then the distance of 0.002 strain is obtained as
\[\left( \frac{0.002}{0.035} \right)X=\left( \frac{4}{7} \right)x=\text{ }0.57x\]
The design compressive stress fc corresponding to any strain εc ≤ 0.0035, as shown in figure, may be approximated by a parabola. The equation for this parabola was first introduced by Hognestad (1952) as
\[~f{{‘}_{c~}}=0.447{{f}_{ck}}\left[ 2\left( \frac{{{\varepsilon }_{c}}}{{{\varepsilon }_{0}}} \right)-{{\left( \frac{{{\varepsilon }_{c}}}{{{\varepsilon }_{0}}} \right)}^{2}} \right]\]
For εc < 0.002, with εco = 0.002
fc = 0.447 fck for 0.002 < εc ≤ 0.0035.
Also Read: Working stress method


Leave a comment